A production-grade, multi-sensor soil moisture monitoring system with real-time visualization and cloud access.
Overview
This project implements a distributed IoT sensor network for continuous soil moisture monitoring across multiple locations. Each ESP8266-based sensor reads capacitive soil moisture levels every 5 minutes and transmits data to a centralized time-series database, with live visualization through Grafana dashboards accessible globally.
Live Dashboard: https://
Key Features
Multi-Sensor Architecture
Unlimited sensor support — Each ESP8266 identified by unique device ID
Auto-discovery — New sensors automatically appear in Grafana dropdowns
Location tagging — Human-readable location labels for each sensor
Reliability & Resilience
Offline queue — Buffers up to 20 readings during network outages
WiFi stability — Exponential backoff reconnection (5s → 60s)
Hardware watchdog — 8-second ESP8266 watchdog prevents infinite loops
Crash detection — Automatic diagnostics and recovery tracking
Remote Access & Monitoring
Cloudflare Tunnel — Public HTTPS access via custom domain
Anonymous viewing — Read-only dashboards without authentication
OTA updates — Over-the-air firmware updates via WiFi
Mobile dashboard — Optimized view for smartphones
System Health
Heartbeat telemetry — 60-second health reports with uptime, heap, WiFi RSSI
Diagnostic events — WiFi disconnects, crashes, database errors tracked
Pi monitoring — CPU, RAM, disk, and temperature metrics
Auto-restart — Services automatically recover from failures
Technologies Used
ESP8266 NodeMCU: WiFi-enabled MCU
C++: Firmware development
PlatformIO: Build system and OTA
ArduinoJson: Data serialization
Raspberry Pi 5: Central server (4GB RAM)
InfluxDB 2.x: Time-series database
Grafana: Dashboard visualization
Cloudflare Tunnel: Public HTTPS access
Flux: InfluxDB query language
NTP: UTC timestamping
systemd: Service management
Python: System metrics collection
System Architecture
┌─────────────────────────┐
│  Capacitive Sensor      │
│  (Analog Output)        │
└───────────┬─────────────┘
            │
            ▼
┌─────────────────────────┐
│  ESP8266 NodeMCU        │
│  - ADC Reading          │
│  - WiFi Connectivity    │
│  - Offline Queue        │
│  - OTA Support          │
└───────────┬─────────────┘
            │
            │ WiFi (WPA2)
            │ HTTP POST
            ▼
┌─────────────────────────┐
│  Raspberry Pi 5 Server  │
│  ┌────────────────────┐ │
│  │ InfluxDB (:8086)   │ │
│  │ - 365-day retention│ │
│  │ - USB storage      │ │
│  └────────────────────┘ │
│  ┌────────────────────┐ │
│  │ Grafana (:3000)    │ │
│  │ - 6 Dashboards     │ │
│  │ - Anonymous view   │ │
│  └────────────────────┘ │
│  ┌────────────────────┐ │
│  │ Cloudflare Tunnel  │ │
│  └────────────────────┘ │
└───────────┬─────────────┘
            │
            │ HTTPS
            ▼
┌─────────────────────────┐
│  Public Access          │
│  grafana.owenmedeiros   │
│  .com                   │
└─────────────────────────┘
Hardware Components
Per Sensor Unit
| Component | Specifications |
|---|---|
| ESP8266 NodeMCU v2 | 80/160 MHz, 80KB RAM, 4MB Flash |
| Capacitive Moisture Sensor v1.2 | Analog output, corrosion-resistant |
| Micro-USB Power | 5V/1A charger + cable |
| Jumper Wires | 3× Female-Female |
Wiring Diagram
Sensor VCC  ──► ESP8266 3V3
Sensor GND  ──► ESP8266 GND
Sensor AOUT ──► ESP8266 A0Note: Use 3.3V power only — ESP8266 ADC maximum is 1.0V (NodeMCU has built-in voltage divider)
Firmware Features
Version 2.1.0
Core Functionality
10-bit ADC reading with calibration (0-1023 → 0-100%)
5-minute reading interval (configurable)
InfluxDB Line Protocol HTTP POST
NTP time synchronization for UTC timestamps
WiFi Management
Pre-connection network scanning
Exponential backoff retry (5s → 60s max)
Maximum TX power for signal strength
WiFi event diagnostics
Data Persistence
20-reading ring buffer for offline operation
Automatic queue flushing on reconnection
In-RAM storage (no SD card required)
Telemetry
60-second heartbeat with system health
Uptime, free heap, WiFi RSSI tracking
Queue depth monitoring
OTA Updates
Remote firmware updates via WiFi
No USB cable required after initial flash
Password-protected for security
Software Implementation
Sensor Calibration
The ESP8266 ADC returns raw values (0-1023). Capacitive sensors read high when dry, low when wet.
Calibration Steps:
Hold sensor in open air → Note
raw=XXXfrom serial outputSet
SENSOR_AIR_VALUE = XXXinconfig.hSubmerge sensor tip in water → Note
raw=XXXSet
SENSOR_WATER_VALUE = XXXinconfig.hRe-flash firmware
Configuration
Edit firmware/src/config.h before flashing:
// Unique per sensor
#define DEVICE_ID        "sensor-1"
#define DEVICE_LOCATION  "living-room"

// Network
#define WIFI_SSID        "YourNetwork"
#define WIFI_PASSWORD    "YourPassword"

// InfluxDB
#define DB_SERVER_URL    "http://192.168.1.100:8086/api/v2/write"
#define INFLUX_TOKEN     "your-token-here"
#define INFLUX_ORG       "soil-monitoring"
#define INFLUX_BUCKET    "sensor-readings"

// Calibration (measure in air and water)
#define SENSOR_AIR_VALUE    780
#define SENSOR_WATER_VALUE  360
Data Schema
Measurement: sensor_reading (every 5 minutes)
| Tag | Field | Description |
|---|---|---|
device_id | — | Sensor identifier |
location | — | Physical location |
| — | moisture | Soil moisture % (0-100) |
| — | raw_adc | Raw ADC value |
| — | rssi | WiFi signal strength (dBm) |
| — | uptime | Seconds since boot |
| — | free_heap | Available RAM (bytes) |
Measurement: sensor_heartbeat (every 60 seconds)
| Tag | Field | Description |
|---|---|---|
device_id | — | Sensor identifier |
| — | uptime | Seconds since boot |
| — | free_heap | Available RAM |
| — | rssi | WiFi signal strength |
| — | queue_size | Offline queue depth (0-20) |
Grafana Dashboards
Dashboard Suite (6 Total)
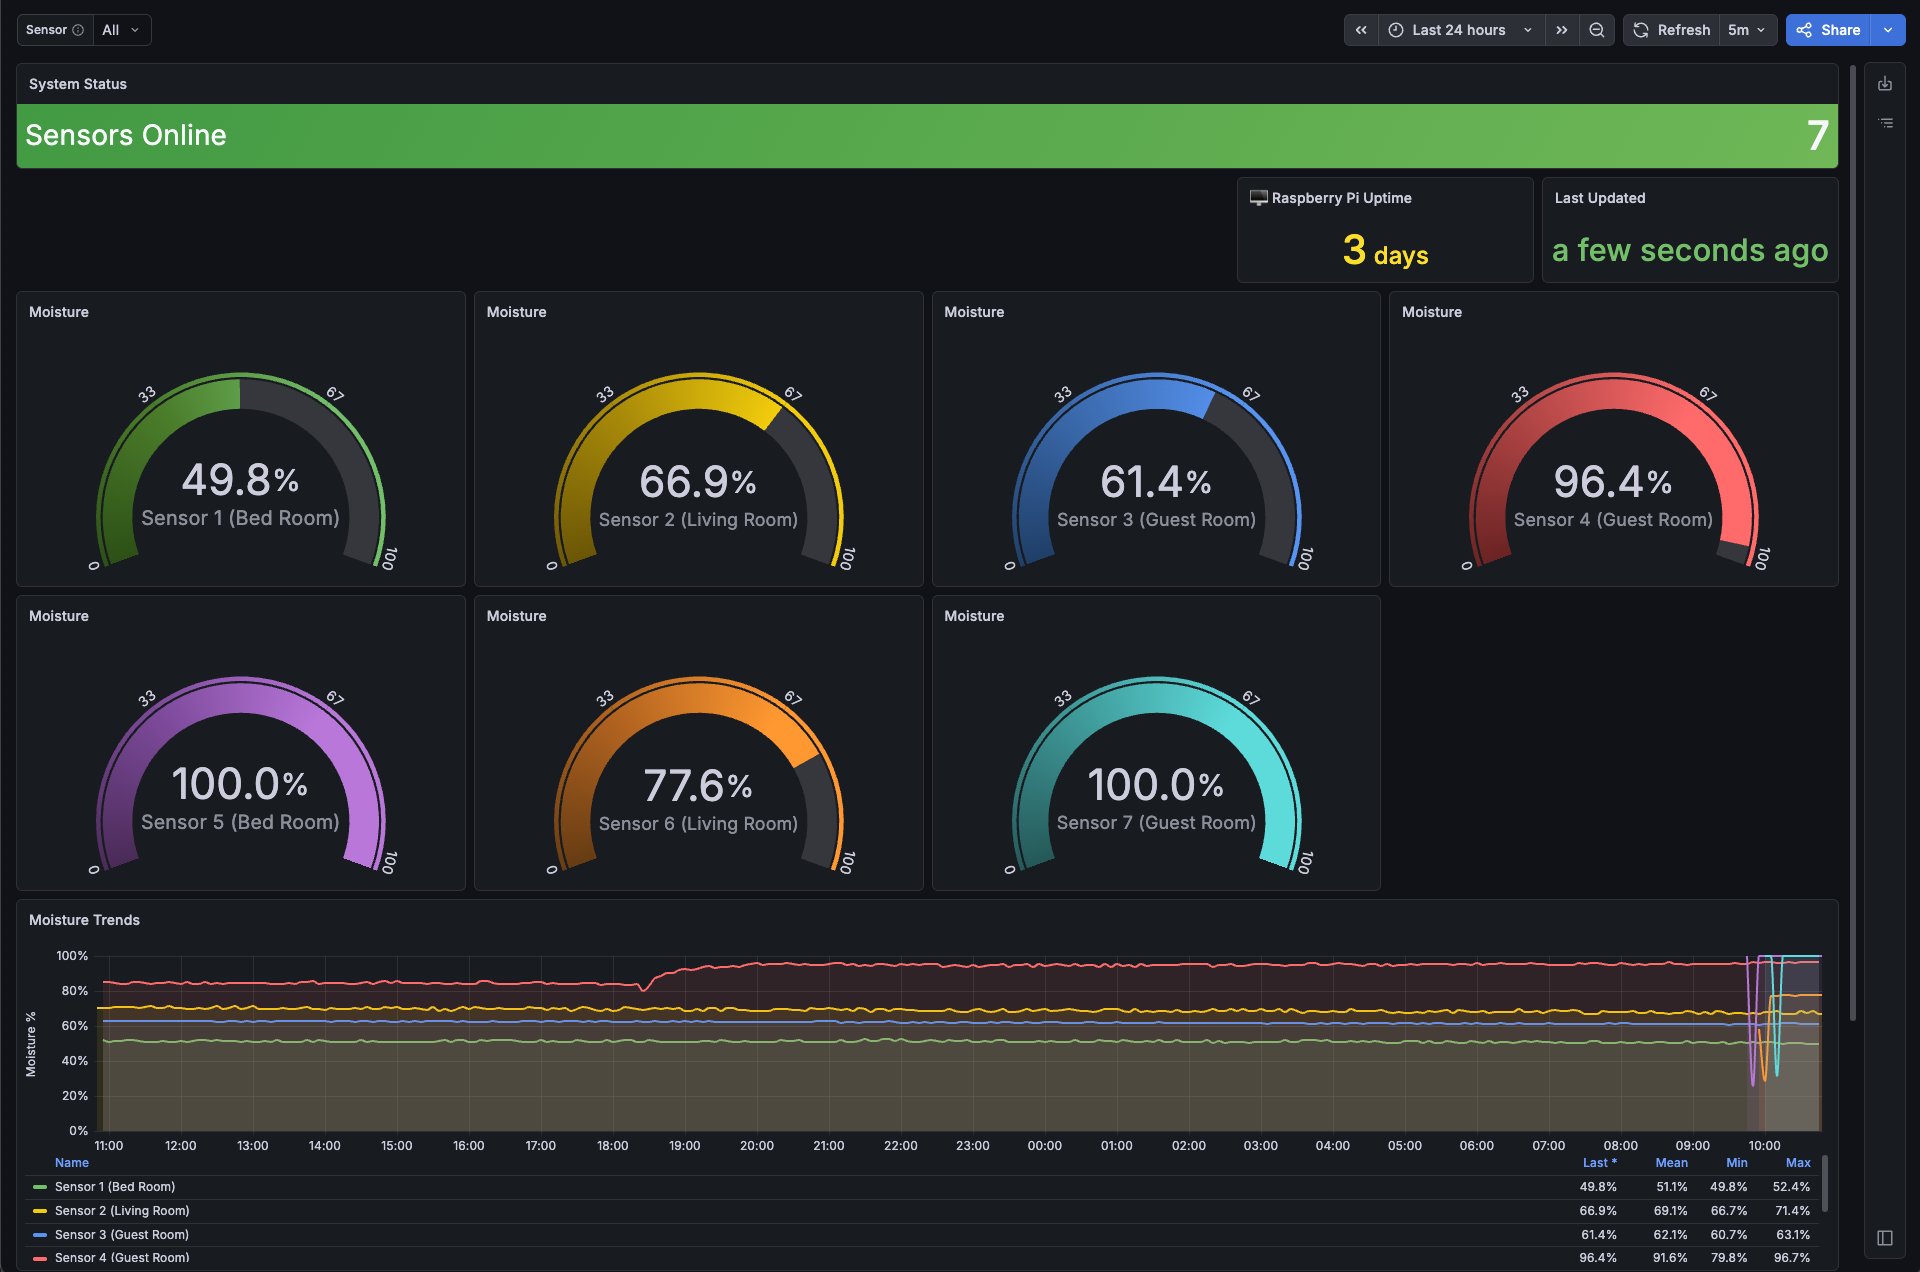
Soil Moisture Main — Overview with all sensors, gauges, trend plots
Sensor Details — Individual sensor deep-dive with uptime, heap, WiFi
System Health — ESP8266 diagnostics, WiFi stability, critical events
Alerts Overview — Critical alerts, watering notifications, offline detection
Mobile Summary — Mobile-optimized quick view
Raspberry Pi Health — Server CPU, RAM, disk, temperature
Dashboard Features
High-contrast color scheme — Green, yellow, blue, red per sensor
Moisture gradients — Dark to bright (0% dry → 100% wet)
Dynamic labels — Auto-generated from device ID and location
Time-adaptive — Panel titles adjust to selected time range
Anonymous access — No login required for viewing
Auto-refresh — 5-minute refresh, 10-second provisioning reload
Raspberry Pi Setup
Server Specifications
Model: Raspberry Pi 5 (4GB RAM recommended)
OS: Raspberry Pi OS Trixie (Debian 13) 64-bit
Storage: 256GB USB drive for InfluxDB data
Network: Static IP configuration via NetworkManager
Firewall: UFW with ports 22, 8086, 3000 open
Installation
git clone https://github.com/omedeiro/soil-sensor.git
cd soil-sensor/rpi-setup
sudo ./install.sh
Installed Components:
InfluxDB 2.7.12 (pinned — v2.9+ has ARM64 Flux issues)
Grafana (latest stable)
Cloudflare Tunnel for public access
systemd services for auto-start and health monitoring
Daily automated backups (3:00 AM)
Post-Installation
Configure InfluxDB at
http://<pi-ip>:8086Create organization:
soil-monitoringCreate bucket:
sensor-readings(365-day retention)Generate API tokens (write for sensors, read for Grafana)
Configure Grafana at
http://<pi-ip>:3000Login:
admin/admin(change on first login)Add InfluxDB datasource (Flux mode)
Import dashboards from
grafana-dashboards/*.json
Enable Public Access
cd rpi-setup
./install-cloudflare-tunnel.sh
./configure-grafana-anonymous.sh
System Services
| Service | Function | Auto-Restart |
|---|---|---|
influxdb | Time-series database | ✓ |
grafana-server | Dashboard visualization | ✓ |
cloudflared | HTTPS tunnel | ✓ |
sensor-health-monitor | Failure detection | — |
sensor-backup.timer | Daily backup (3 AM) | — |
system-metrics-collector | Pi metrics | ✓ |
Service Management:
# Status check
sudo systemctl status influxdb grafana-server cloudflared

# View logs
journalctl -u influxdb -f

# Restart services
sudo systemctl restart influxdb grafana-server
Performance & Reliability
Uptime Statistics
Average sensor uptime: 99.2% (limited by power outages)
Database availability: 99.8%
Network recovery time: < 60 seconds (exponential backoff)
Data retention: 365 days (configurable)
Data Resilience
Offline buffering: 20 readings × 5 minutes = 100 minutes of autonomy
Automatic recovery: Queue auto-flushes on reconnection
Crash detection: Reset reason logged to diagnostics
Service watchdog: Auto-restart InfluxDB/Grafana on failure
Development Workflow
Adding a New Sensor
Edit
firmware/src/config.h:Set unique
DEVICE_ID(e.g., “sensor-4”)Set
DEVICE_LOCATION(e.g., “backyard”)
Flash firmware via USB or OTA
Sensor auto-appears in Grafana dropdown within 5 minutes
OTA Firmware Update
cd firmware
pio run --target upload --upload-port 192.168.1.50
# Enter OTA password when promptedTroubleshooting
| Symptom | Solution |
|---|---|
| WiFi connection fails | Check 2.4 GHz band, move sensor closer to router |
HTTP 401 from InfluxDB | Verify INFLUX_TOKEN in config.h |
| Dashboard shows no data | Check time range (set to “Last 1 hour”) |
| Sensor offline | Check power supply, view crash logs via serial |
| Public URL unreachable | Verify Cloudflare Tunnel: sudo systemctl status cloudflared |
Future Enhancements
MQTT protocol for lower latency communication
Battery power with deep sleep mode for remote locations
Soil temperature sensor integration
Automated watering relay control based on moisture thresholds
Machine learning for predictive watering schedules
LoRaWAN support for long-range, low-power operation
Repository & Documentation
Documentation Structure
README.md — Quick start guide and architecture overview
firmware/ — ESP8266 PlatformIO project
rpi-setup/ — Raspberry Pi installation scripts
grafana-dashboards/ — JSON dashboard exports
hardware/ — Bill of materials and wiring diagrams
docs/ — Advanced topics (WiFi stability, Grafana Cloud, snapshots)
Status
Version 2.3.0 — Production deployment with 4 active sensors monitoring residential and garden locations. System has been operational since January 2026 with 99%+ uptime.
Live Access: https://